Lead Scoring and Segmentation

Table of contents
- Introduction
- Objectives
- Understanding the problem
- Project design
- Data quality
- Exploratory data analysis
- Feature transformation
- Lead segmentation model
- Lead scoring model
- Model deployment - Web app
Introduction
The client is an online education company which sells an online course to industry professionals.
The company markets their course on different websites and search engines. Once professionals who are interested in the course land on the website, they might browse the course or fill up a form for the course or watch some videos. When these people fill up a form providing their email address or phone number, they are classified to be a lead. Moreover, the company also gets leads through past referrals.
Once these leads are acquired, employees from the sales team start making calls, writing emails, etc. Through this process, some of the leads get converted while most do not, with the inefficiency of this process impacting company’s benefits.
Notes:
- This article presents a technical explanation of the development process followed in the project.
- Source code can be found here.
- Feel free to test the developed web application here.
Objectives
-
Analysing historical leads information to propose potential actions that increase overall company turnover.
-
Creating advanced analytical assets such as a
predictive lead scoring andcustomer segmentation algorithms that helps sales team to identify both potential customers who are most likely to convert into paying customers and leads who are not economically profitable to manage.
Understanding the problem
When most companies start implementing inbound marketing, they’re primarily worried about getting enough new leads. However, once the marketing team defines and implements the right strategies and the systems the company has in place start working properly, getting enough leads is usually no longer a problem.

The challenge now is that in many cases the number of leads captured exceeds the capacity of the commercial channels, which generates problems such as:
- Conflicts between marketing and sales departments: When there are so many leads coming in but not many sales being closed, these two departments may turn on one another. The marketing department does not understand how they are providing a large number of leads that Sales can not close. And the sales department believes that quality is more important than quantity, and they are not getting any good leads.
- Saturation of the commercial channel, given that each salesperson can manage a limited number of leads per day.
- Achieving fewer results than potentially possible, since there are a large number of leads that are not really interested in the company’s product and contact them takes time away from salespeople and prevents them from closing sales.
For all the above reasons, it becomes necessary to prioritize in order to reach out to the “best” leads quickly, while saving the “less likely” leads for last or leaving these “less likely” leads to be handled by more automated channels such as email.
Nevertheless, businesses have struggled with prioritizing lead follow-up for decades. In many cases, salespeople are left to their own devices, using their best judgment to decide who gets contacted first. Marketers and salespeople use data such as demographic info (age, marital status, industry, role, …), to rank potential customers as to how likely they are to buy. The problem with this approach is that it has a certain component of subjectivity. Salespeople are forced to rely on “gut feelings” and factor in their own historical experience to make this decision. Neither of these proves to be consistently accurate causing quality leads to slip through the cracks as they chase prospects unlikely to buy.
On the other hand, to implement an effective inbound marketing strategy is vital to have knowledge about the type of leads interested in the company’s product to drive dynamic content and personalization tactics for timelier, relevant and more effective marketing communications. To this end, appropriate customer segmentation can help to cluster leads into groups sharing the same properties or behavioral characteristics instead of a ‘one-size-fits-all’ approach, which may prove to be in determine new market opportunities and improve brand strategy, marketing efficiency and customer retention between other benefits.
Project design
Methodology
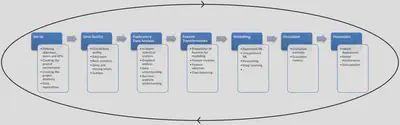
Traditionally there have been two main methodologies for advanced data modelling: CRISP-DM and SEMMA. Both methodologies structure the data mining project in phases that are interrelated, converting the process into iterative and interactive.
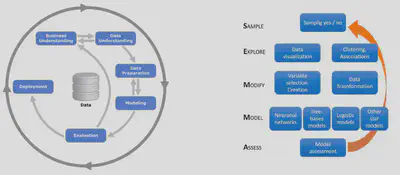
This project has been designed using a methodology halfway between the two presented above, as shown in the figure below.
Levers
There is usually a limitless number of things a company can consider trying in order to improve their business. However, the options should be narrowed down to include only the levers most relevant to the company and their situation and goals, which in this case are:-
Leads: - Obtain knowledge of the leads captured by the company to optimise future commercial campaigns.
-
Conversion rate: - If the rate at which leads become customers is increased, the company’s profits will also increase.
-
Comercial channels optimisation: - The client uses different sales channels to communicate with leads (phone calls, sms, emails, web chat and a subcontracted lead management company). By knowing the propensity to purchase of each lead, the company will be able to prioritise the management of the most promising leads through the most appropriate commercial channel for each of them.
KPIs
Lead-to-customer conversion rate (CR) defined as:
-
$N_{\text{customers}}:$ number leads converted into paying customer.
-
$N_{\text{leads}}:$ total number of leads.
-
Sales team workload: number of potential customers to be managed by the sales team. -
Lost investment in not converted lead management: cost of commercial actions carried out on potential customers who do not end up buying the company’s product. -
Sales profit (SP): total profit from the sale of the online courses, defined as: $$ SP\,(\$) = N_{\text{customers}}\cdot (Price_{\text{product}}-Cost_{\text{lead to customer}})-Costs_{\text{leads not converted}} $$
-
$N_{\text{customers}}:$ number leads converted into paying customer.
-
$Price_{\text{product}}:$ price of the online course for industry professional.
-
$Cost_{\text{lead to customer}}:$ cost per lead arising from commercial and marketing actions.
-
$Costs_{\text{leads not converted}}:$ lost investment in not converted lead management.
Entities and data
The entities relevant to the achievement of the project's objectives and for which data are available are:Leads: - The leads data available are those provided by the client in a .csv file which contains information on 37 different features for 9240 different leads. Further information about the available features and their description are also provided in a .pdf document.

-
Product: - Description: Online course for industry professional.
- Price: 49.99 $.
-
Comercial channels optimisation: - Phone calls, Sms, Email, Olark Chat, Subcontracted lead management company, Ad campaigns.
- Lead management average cost: 3.25 $ per lead.
Data quality
In this stage of the project, general data quality correction processes have been applied, such as:
- Feature renaming
- Feature type correction
- Elimination of features with unique values
- Nulls imputation
- Outliers management
The entire process can be consulted in detail here.
Exploratory data analysis
The aim of this stage of the project is to discover trends, patterns, and to check assumptions with the help of statistical summary and graphical representations. Complete analysis can be found here.
In order to guide the process, a series of seed questions were posed to serve as a basis for developing and deepening the analysis of the different features.
Seed questions
Regarding Leads:
Q1: What are the main demographic profiles in the company’s lead database?
Regarding Conversion Rate:
Q2: What is the lead-to-customer conversion rate the company is currently achieving?Q3: What factors affect lead-to-customer conversion the most?
Regarding commercial and marketing channels:
Q4: How are the company’s commercial/marketing channels performing?Q5: From what sources is the company attracting potential customers? Which are the most promising ones?Q6: Which demographic profile should be the main focus of marketing actions?Q7: What percentage of leads are open to receiving communications by email or phone calls?Q8: How did the company’s advertising campaigns perform?Q9: How is the current lead magnet performing?
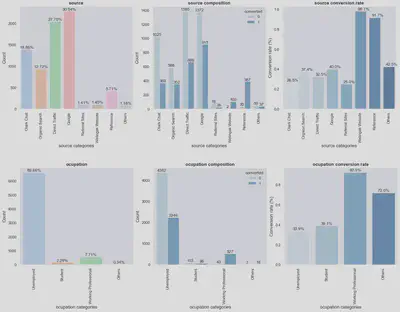
Example of the analysis of some of the categorical features present in the dataset:
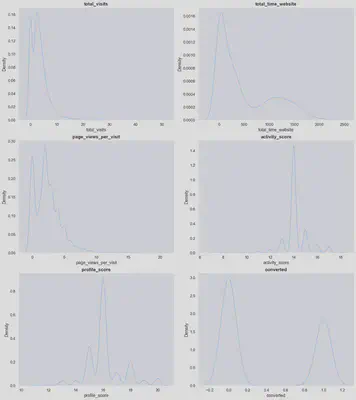
Example of one of the analyses carried out on numerical features present in the dataset:
Insights
Leads:
- The vast majority (89,7%) of the interested customers that the company is currently attracting are unemployed.
- Only 7.7% of leads are working professionals.
- Activity and profile index features are missing for 45.4% of the leads.
Lead-to-customer conversion rate:
- Current lead-to-customer conversion rate is 38.6%.
- Working professionals have high conversion rate (92.5%), especially those from management sector.
- Unemploeyed leads, although high in number, have low conversion rate (33.9%).
- Almost all leads coming from ‘Reference’ (91.7% conv. rate) and ‘Welingak Website’ (98.1% conv. rate) sources end up buying the product. However, only 2.8% of leads come from these sources.
- Leads who hear about the company through recommendations (World of mouth, Student of someschool) have higher conversion rates.
Commercial and marketing channels:
- Converted leads spent a median of 10 minutes more time viewing the website than those who did not convert, regardless to the amount of visits and number of pages viewed.
- Only 0.24% of the leads indicated on the form that they have seen advertisements from the company. Around 92% of leads do not like to be called or receive emails about the course.
- Employees are not sure about the quality of 63% of leads, and only have time/information to fill in the lead profile field for 26.1% of all leads.
- Email marketing campaigns have untapped potential, as the last notable activity/last activity of 30%-37% of total number of leads was opening an email but only about 37% of them were converted after it. Only 14.8% of leads who want to be contacted by email end up converting into paying customers.
- Sms campaigns achieved conversion rates of 60%-70% and reached a significant number of leads.
- There are leads tagged as ‘Ringing’ who selected ‘do not want to receive phone calls’ on the form.
- Most potential customers were not interested in getting a free copy of the lead magnet. Leads interested in downloading the lead magnet are mostly unemployed and download it mainly from the landing page.
Actions to improve company's customer knowledge
- Improve quality of the survey or form questions to receive more user inputs and reduce NaN/default (‘Select’) values.
- Improve algorithm for the activity and profile score/index to produce complete and more accurate results.
- Colect time stamp visiting the website for seasonality analysis and implement cookies to identity and track users as they navigate different pages on the website.
- Implement a new
lead segmentation algorithm that identifies the company’s different leads profiles and makes it possible to identify which group best fit for each new lead, in order to be able to carry out more personalised commercial actions.
Actions to improve lead-to-customer conversion rate
- Implement a
predictive lead scoring algorithm that identifies people who are most likely to convert into paying customers and relieves the sales team of the workload of manually filling in features such as lead_quality, lead_profile or tags so they will be able to spend more time on contacting the most promising customers.
Actions to improve commercial and marketing channels performance
-
Improve the content strategy of the website, lead magnet and emails to attract traffic and increase the time people spend on the website by creating tailored content mainly for working professionals in the Indian management sector.
-
Create a referral program to encourage existing customers to recommend the course to their friends, family, and colleagues.
-
Invest more resources into acquiring leads from ‘Welingak website’.
-
Increase investments in SMS campaigns as they are performing well.
-
Check whether the default value for advertisement features is set to ‘No’ in the web form, which could explain the high percentage of ‘No’ for all of them. If this is not the case, then the advertising investment strategy should be completely revised as it is not generating almost any lead (0,24%).
-
Check that the sales team is only contacting people who have given their consent to do so.
Feature transformation
At this stage of the project, different variable transformation techniques will be applied to adapt them to the requirements of the algorithms that will be used during the modelling phase.
As discussed during the exploratory data analysis stage, two different models will be developed:
- A lead segmentation model that helps sales and marketing teams to identify the company’s different leads profiles.
- A predictive lead scoring model that identifies people who are most likely to convert into paying customers. In both cases, categorical features have to be transformed into numerical features. Given that the categorical features in the dataset are of the nominal type, one hot encoding technique will be used for this purpose.
Unsupervised modelling techniques based on Kmeans algorithm will be used for lead segmentation model. Kmeans is very sensitive to the different scales of the features as it is a distance-based algorithm, therefore rescaling techniques have to be applied to ensure that all features are on the same scale. Since it has been decided to apply one hot encoding to categorical features, the rescaling technique that makes the most sense to apply in this case is min-max scaling which will allow transforming feature values to a scale between 0 and 1.
On the other hand, it has to be decided whether feature discretisation/binarisation processes are to be applied. Given that for the project to be developed the objective of prediction is more important than interpretation one, and also taking into account that one of the models to be developed is based on a segmentation algorithm, neither discretisation nor binarisation processes will be applied.
Finally, note that it is not necessary to apply class balancing processes as the presence of both classes in the dataset (converted=1, converted=0) is sufficiently significant.
Lead segmentation model
Customer segmentation based on unsupervised modelling will be developed by applying the Kmeans algorithm, in order to find new insights which help to improve company’s sales and marketing campaigns and so increase lead-to-customer conversion rate.
Selecting the number of segments
Different methods have been used to identify the optimal number of clusters to be considered in the application of the Kmeans algorithm.
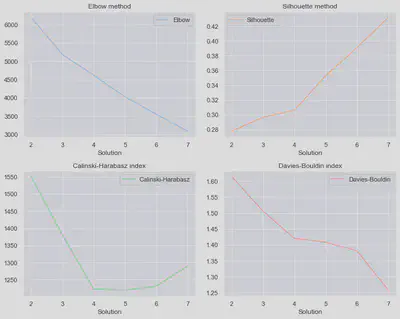
Analysing the above graphs, it can be seen that:
-
Elbow method: It does not provide useful information in this case as it shows a linear decrease in errors.
-
Silhouette method: Better results with increasing number of clusters.
-
Calinski-Harabasz index: 2 or 3 clusters provide the best solutions. Results with 6 or 7 clusters are better than with 4 or 5.
-
Davies-Bouldin index: Better results with increasing number of clusters.
After an iterative process, it is found that the number of clusters that provides the most business meaningful segmentation is 6.
Segment profiling
Once the optimal number of clusters has been selected, and the segmentation features to be used have been chosen, the model is trained and executed, assigning each lead to one of the six existing clusters.
Average values have been calculated for each of the features introduced in the model, in order to try to identify which are the most differentiating characteristics of each segment from a business point of view.
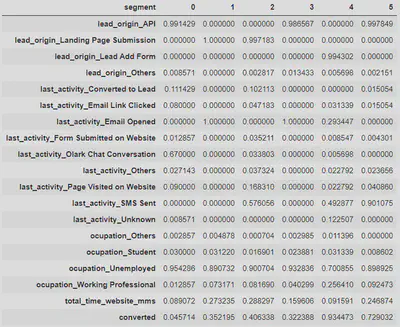
Segment descriptions
After analysing the above results, the descriptions of the most differential points of each of the segments identified by the algorithm are presented.
- Origin: API.
- Last activity: Most leads have conversations via Olark chat.
- Segment with lower presence of working professionals.
- Time spent on the website far below average.
- Almost no leads in this segment buy the company’s product.
- Origin: Landing Page.
- Last activity: Email Opened.
- Some presence of working professionals.
- Above-average time spent on the website.
- Slightly lower conversion rate than the company’s current average conversion rate.
- Origin: Landing Page.
- Last activity: Most of them have received an SMS. Some of them have visited the website.
- Some presence of working professionals.
- Above-average time spent on the website.
- Slightly higher conversion rate than the company’s current average conversion rate.
- Origin: API.
- Last activity: Email Opened.
- Some presence of working professionals.
- Below average time spent on website.
- Slightly lower conversion rate than the company’s current one. Similar to the conversion rate of segment 1.
- Origin: Lead Add Form (main sources: References, Welingak website).
- Last activity: Email Opened, SMS sent or unknown.
- High presence of working professionals.
- Time spent on the website far below average.
- 9 out of 10 leads in this segment end up buying the company’s product.
- Origin: API.
- Last activity: SMS sent.
- Notable presence of working professionals.
- Above-average time spent on the website.
- Conversion rate significantly higher than the company’s current average conversion rate.
Segmentation insights
-
The company’s most valuable leads are those that come from referrals or from Welingak website, and even more so if they are working professionals. As proposed in the exploratory data analysis section, the company should seriously consider creating a referral programme to encourage existing customers to recommend the course to their close circle.
-
SMS campaigns are performing quite well. However, these campaigns should focus on:
- Working professionals comming from API or landing page who spend above-average time on the website.
- Leads comming from References or Welingak website regardless of their occupation and time spend on the website.
- Avoid sending sms to leads who come from API and have spent a short time on the site.
-
Olark chat is not performing well. The company should consider withdrawing investment in this service and for leads coming from API replace it with:
- Email marketing campaigns in case of working professionals who spent a short time on the website or in case of unemployed leads.
- SMS campaigns in case of working professionals who spend above-average time on the website, as discussed in the previous point.
Lead scoring model
Feature selection
At this stage of the project most useful features to a model in order to predict the target variable will be selected by comparing the results of different selection methods, to both improve the performance of the model and reduce the computational cost of modelling.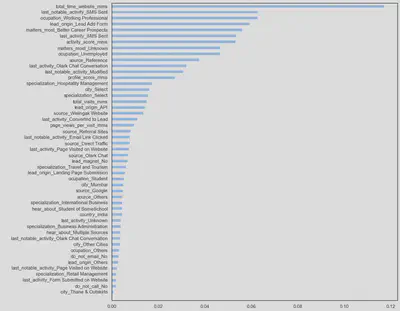
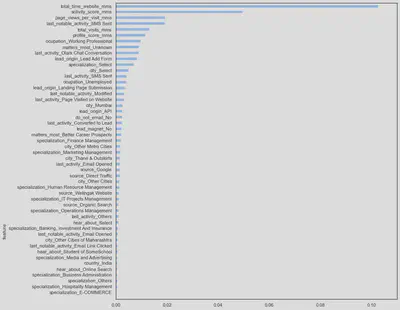
The results provided by the feature selection methods analysed are similar in terms of the number and features selected. However, features selected by mutual information method are taken as a basis since features such as ‘source_Reference’ or ‘source_Olark Chat’ are being taken into account, which could be predictives as discussed in the exploratory data analysis and unsupervised customer segmentation stages.
After that, the set of pre-selected features is tested for significant correlations, as the algorithm to be used has not yet been decided at this stage of the project. The existence of strong correlations, while not a drawback for tree-based algorithms, may reduce the performance of other algorithms such as logistic regressions, etc.
A compromise is therefore sought between the predictive ability of each feature and the number and importance of its correlations with other pre-selected features.
Finally, after eliminating 9 of the features, the final set of features to be introduced into the predictive model is obtained.
Model selection
Different combinations of algorithms/hyperparameters have been tested to find those with the best performance.Models obtaining the best ROC AUC scores are those based on Gradient Boosted Machines (XGBoost, LightGBM). However, there does not seem to be much difference with respect to the scores obtained in the best parameterisations of logistic regression algorithms.
On the other hand, scores obtained in the tested algorithms/parametrisations remains stable during cross-validation process, which is a good indicator of the stability of the model predictions.
The best parameterisation of each type of algorithm (XGBoost, LightGBM, Logistic Regression) will be selected in order to analyse in detail whether there are significant differences in their performance that could lead to the selection of the final algorithm architecture to be used.
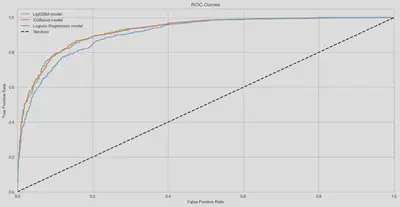
As can be seen from the graph, there are no major differences in the performance of the three models compared.
- ROC curves of LightGBM and XGBoost models are almost identical, as is their predictive ability.
- Model based on the logistic regression algorithm has a slightly worse ROC curve than the two tree-based models.
It was decided to implement the logistic regression algorithm for the project due to the following reasons:
- Its predictive ability is very similar to that obtained with the LightGBM and XGBoost models.
- It is a much more interpretable model than LightGBM or XGBoost algorithms.
- It is a simpler model, therefore easier to maintain and quicker to train, re-train and execute.
- It can be easily migrated to the platforms and software currently used by the company due to its mathematical simplicity.
Selecting optimal discrimination threshold that maximises ROI
This section analyses what is the optimal discrimination threshold value that maximises the company's return on investment. In this way, in addition to the scoring, the model developed will indicate for each customer whether it should be subject to commercial actions or whether it is not worth investing resources in managing it.As reported by the company, its revenue and cost scenario is as follows:
- Product selling price (online course for industry professional): 49.99 $
- Lead-to-customer average cost: 3.25 $ customer.
To find the optimal value of the discrimination threshold the confusion matrix and a business defined economic impact matrix will be used.
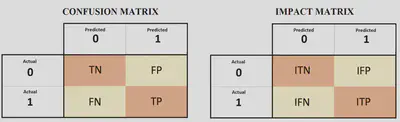
- Confusion matrices represent counts from predicted and actual values. The output “TN” stands for True Negative which shows the number of negative examples classified accurately. Similarly, “TP” stands for True Positive which indicates the number of positive examples classified accurately. The term “FP” shows False Positive value, i.e., the number of actual negative examples classified as positive; and “FN” means a False Negative value which is the number of actual positive examples classified as negative.
- It accounts for the economic impact represented by each of the components of the confusion matrix. The output “ITN” stands for Impact of True Negative which shows the economic impact of not to carry out any commercial actions on those leads that were not going to buy the product. Similarly, “ITP” stands for Impact of True Positive which indicates the net profit obtained from commercial actions on customers who end up buying the course. The term “IFP” shows Impact of False Positive value, i.e., the opportunity cost of not having carried out commercial actions on leads who would have become customers. Finally, “IFN” means a Impact of False Negative value which represent the economic cost of commercial actions carried out on a lead that finally does not buy the company’s product.
By calculating the confusion matrix multiplying it by the economic impact matrix for each of the possible values of the discrimination threshold it will be possible to assess which discrimination threshold maximises the resulting function and thus company’s ROI.
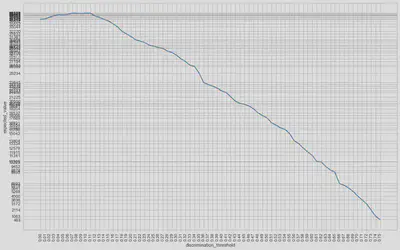
In this case, the discrimination threshold value that provides a higher return on investment for the company is 0.07.
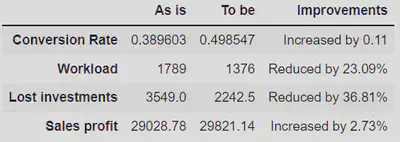
Model results: KPIs improvements achieved
Finally, the model has been tested on a batch of 1848 leeds never seen before by the model. By applying the developed lead scoring predictive model, the company has been able to:
- Increase its sales profit by 2.7%.
- Save 36.8% of the amount of money lost due to the management of low quality leads.
- Increase lead-to-customer conversion rate from 38% to 50%.
- Save 23% of time spent by employees on managing leads.
Model deployment - Web app
In order to get the most value out of the developed machine learning model, it is important to seamlessly deploy it into production so employees can start using them to make practical decisions.
To this end, a prototype web application has been designed. This will collect, on the one hand, the internal data that the company has for each lead (time spent on the website, number of visits, origin…) and on the other hand, the information provided by the lead itself through a web form.

Once the data has been entered, by clicking on “CALCULATE SCORING” button, the application will run the machine learning model on the data and will return both the lead score and the recommendation as to whether or not it is profitable to carry out commercial actions on the lead.

Pedro Cortés Macías
Data scientist · Industrial Engineer
I love solving problems. More specifically, I love solving problems using code, maths and business knowledge. Using it for analysis and automation, helping people and companies to be more productive, make better decisions and create data-driven assets.