Ecommerce Optimisation

Note: Current documentation available on the GitHub repository is in Spanish. It will soon be updated to English.
Table of contents
Introduction
The client is an ecommerce in the cosmetics sector that seeks to break the trend of null evolution obtained during the last months.
Notes:
- This article presents a technical explanation of the development process followed in the project.
- Source code can be found here.
Objectives
-
Analysing the ecommerce transactional data to find potential conversion rate optimisation (CRO) actions that increase visits, conversions and the average ticket, and therefore increase overall ecommerce revenue.
-
Creating advanced analytical assets such as RFM segmentation and a recommendation system to drive goal achievement.
Project design
Understanding the business model
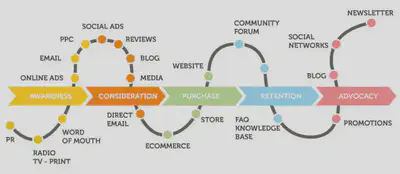
First step in selling products online is when a user arrives at the ecommerce website. Normally it will come from:
- Paid campaigns: paid ads such as Facebook Ads or Google Ads.
- Organic content: blog, rrss, …
- Direct traffic: the client knows the url and enter it directly in the browser.
That traffic is called visits, and the pages that potential customers view are called page views.
The user browses the website and when he/she likes a product he/she puts it in the cart. Eventually the potential client can remove products from the cart, leave the website without buying anything, or finally place the order.
A common process in this type of business is cross-selling, in which the user is recommended other products that might also be of interest to him/her. Even when the user has left the website, it is possible to contact him again through retargeting or email marketing. This whole process is called funnel or customer journey.
In the online environment virtually everything can be registered. The customer’s registration can be logged, his/her sequence of actions in the same browsing session can be tracked, etc.
Regarding the metrics used in this type of business, one of the most important is the ratio of purchases to visits, also known as conversion ratio. There are also other key metrics that are necessary to know in order to manage an ecommerce properly:
- CPA: Cost Per Acquisition
- AOV: Average Order Value
- Frequency of Purchase
- LTV: Life Time Value
- Churn: A measure of how many customers stop using a product. It is more applicable to recurring payment ecommerces (SaaS, etc…).
Levers
There are three main ways to grow this type of business: obtaining new customers (which means getting more visits and higher conversion rates), increasing the purchase frequency of existing customers, and increasing the average ticket value, which means getting more or higher value products purchased in the same shopping session.In order to achieve these 3 effects, this project will work on the following operational levers:
Customer journey: How every step of the journey can be optimised?Customers: How can the available customer information be used to optimise the company’s commercial campaigns?Products: How can the product catalog be optimised? How can the company identify in a personalised way the best products to show to each customer?
KPIs
Visits Conversion rate Purchase frequency AOV: Average Order ValueShopping Cart Abandonment Rate LTV: Life Time Value
Entities and data
The existing entities in the granularity of ecommerce available data are:Users: id, session…Clients: number of products purchased, average order cost, frequency of purchase…Sessions: session ID.Events: visits, products added to cart, sales, event time…Products: price, number of units sold, brand…
Data quality
In this stage of the project, general data quality correction processes have been applied, such as:
- Feature renaming
- Feature type correction
- Elimination of features with unique values
- Nulls imputation
- Outliers management
- …
The entire process can be consulted in detail here.
Exploratory data analysis
The aim of this stage of the project is to discover trends, patterns, and to check assumptions with the help of statistical summary and graphical representations. Complete analysis can be found here.
In order to guide the process, a series of seed questions were posed to serve as a basis for developing and deepening the analysis of the different features.
Seed questions
Regarding customer journey:
Q1: What does a typical shopping process look like?Q2: How many products are viewed, added to cart, abandoned and purchased on average per session?Q3: How have these metrics been trending in recent months?
Regarding clients:
Q4: How many products does each customer buy?Q5: How much does each customer spend on average?Q6: Are there ‘good customers’ that need to be identified and treated differently?Q7: Do customers repeat purchases in the following months?Q8: What is the average LTV of a customer?Q9: Can campaigns can be tailored to customer’s value?
Regarding products:
Q10: What are the best-selling products?Q11: Are there products that do not sell?Q12: Is there a relationship between the price of the product and its sales volume?Q13: Are there products that are visited but not purchased?Q14: Are there products that are recurrently removed from the cart?Q15: Could personalized product recommendations be made for each customer?
Example of some of the analyses that have been conducted:

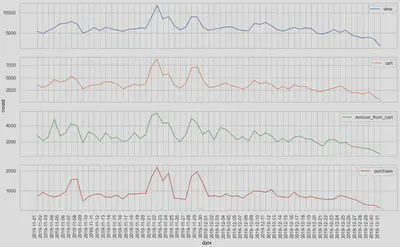
Insights (baseline)
-
In each session, on average:
- 2.2 products are viewed.
- 1.3 items are added to cart.
- 0.9 items were removed from your cart.
- 0.3 products are purchased.
-
Cross-selling: average of 5 products per purchase.
-
Recurrence: 10% of customers return to purchase after the first month.
-
Conversion rates:
- 60% of add to cart over views.
- 22% of purchases over cart additions.
- 13% of purchases over views.
-
Average monthly turnover: 125.000€.
Results
A plan of 10 specific initiatives organized into 5 major business levers has been derived from the exploratory data analysis to break the flat evolution of the company’s KPIs over the last few months and achieve an overall increase in ecommerce revenues:
Actions to increase the number of views
- Revise paid campaigns (generation and retargeting) to concentrate investment in time slots between 9am and 1pm and between 6pm and 8pm.
- Concentrate investment in Christmas and post-Christmas campaigns in the week of black friday.
- Increase investment to the maximum CPA based on the LTV identified.
Actions to increase conversion rates
- Preconfigure the home page with the products identified in the most viewed and most sold analysis.
- Work on products with high cart abandonment rate.
- Work on products that are highly viewed but rarely purchased and on products that are highly purchased but rarely viewed.
Actions to increase cross-selling
- The median purchase includes 5 products. Increase this ratio through real-time recommendation with the new recommender.
Actions to increase purchase frequency
- 90% of customers make only one purchase. Create a regular newsletter with the new recommendation system to increase visit frequency.
- Conduct promotional campaigns on the top segments of the RFM segmentation.
Customer loyalty actions
- Create a loyalty program segmented by the new developed RFM segmentation.
Pedro Cortés Macías
Data scientist · Industrial Engineer
I love solving problems. More specifically, I love solving problems using code, maths and business knowledge. Using it for analysis and automation, helping people and companies to be more productive, make better decisions and create data-driven assets.