AirBnb Vacation Rental Market Analysis

Note: Current documentation available on the GitHub repository is in Spanish. It will soon be updated to English.
Table of contents
Introduction
The client is a Real Estate company that invests in large cities by buying properties to later rent them out as vacation apartments.
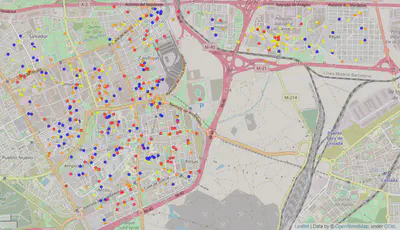
The managers have made the decision to invest in Madrid, and are interested in analysing the data that the sector leader AirBnb makes public to try to find the types of properties that have the greatest commercial potential for vacation rental.
As a main deliverable, the management expects to receive the typology (or typologies) of properties that the valuation team should look for among the existing opportunities in the city and the main neighborhoods or geographic areas to focus on.
Notes:
- This article presents a technical explanation of the development process followed in the project.
- Source code can be found here.
Objectives
Analysing available public data sources to find insights that help to understand the characteristics of the market in Madrid city and guide the valuation team’s research work, especially in terms of the main angles: rental prices, occupancy levels and purchase prices.
Project design
Levers
There is usually a limitless number of things a company can consider trying in order to improve their business. However, the options should be narrowed down to include only the levers most relevant to the company and their situation and goals, which in this case are:-
Rental price: The more the company can charge per night the higher the profitability -
Occupancy level: In general, the more days per year a property can be rented, the higher its profitability. -
Purchase price: The cheaper the property can be acquired the greater the profitability
KPIs
In this case the Kpis are fairly straightforward:Occupancy will be measured as the number of days per year that the property can be rented.- The
rental price will be measured as the price per night in euros according to the Airbnb platform. - The
price of a property will be measured as the multiplication between the number of square meters and the average price per square meter in your area. A 25% discount will be applied on the official price to take into account the negotiating strength of the company’s experienced buying team.
Entities and data
Real data from the Airbnb and Idealista platforms have been used in this project. The entities relevant to the achievement of the project’s objectives and for which data are available are:
Properties: location, price, room type, reviews, minimun/maximum nights, number of bedrooms, …Hosts: Name, id, url, location, verifications, …Districts: Neighborhood, district, …
Data quality
In this stage of the project, general data quality correction processes have been applied, such as:
- Feature renaming
- Feature type correction
- Elimination of features with unique values
- Nulls imputation
- Outliers management
- …
The entire process can be consulted in detail here.
Exploratory data analysis
The aim of this stage of the project is to discover trends, patterns, and to check assumptions with the help of statistical summary and graphical representations. Complete analysis can be found here.
In order to guide the process, a series of seed questions were posed to serve as a basis for developing and deepening the analysis of the different features.
Seed questions
Regarding rental price:
Q1: What is the average price and price range, by districts and neighborhoods?Q2: What is the ranking of districts and neighborhoods by average rental price?Q3: What factors (other than location) determine the rental price?Q4: What is the relationship between the size of the property and the price at which it can be rented?Q5: How does competition (number of available properties per neighborhood) influence the rental price?Q6: How do prices vary by type of rental (whole apartment, private room, shared room)?
Regarding occupancy level:
Q7: What is the average occupancy level by district and by neighborhood?Q8: How likely is each occupancy level in each district?Q9: What is the ranking of districts and neighborhoods by occupancy level?Q10: What factors (other than location) determine occupancy level?Q11: What is the relationship between property size and occupancy level?Q12: How does competition (number of properties available per district) influence occupancy level?
Regarding purchase price:
Q13: What is the ranking of price per m2 by district?Q14: What is the ranking of property price (m2 * average size) by district?Q15: What is the relationship between property price and rental price by district?Q16: What is the relationship between property price and occupancy by district?
Insights
Once the exploratory data analysis has been carried out, the following executive conclusions have been obtained:- 10 neighborhoods have been located in which to focus the search for properties.
- It is recommended to look for one-bedroom properties that can accommodate 3 guests.
- It is recommended to look for properties in one of the identified neighborhoods that are not necessarily close to points of interest.
- A new business model based on rentals for specific moments of high sporting interest, especially in the San Blas neighborhood should be explored.
Results communication
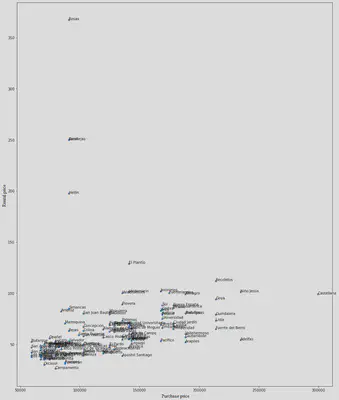
10 neighborhoods with a high investment potential have been identified
- There are 10 neighborhoods that a priori can maximize the cost-income ratio.
- They can also be segmented by the type and quality of the property in which we are interested in investing in 4 main groups.
- These are the neighborhoods where to start looking for specific opportunities:
- Low Investment: Simancas, Ambroz, Marroquina, San Juan Bautista.
- Medium investment: El Plantio, Valdemarín, Valdefuentes.
- Medium-high investment: Jerónimos, Fuentela reina.
- High investment: Recoletos.
It is recommended to search for one-bedroom properties that can accommodate 3 guests
- The number of guests that maximizes the purchase price paid is 3.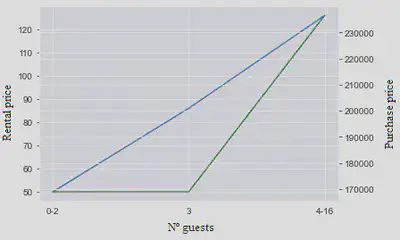
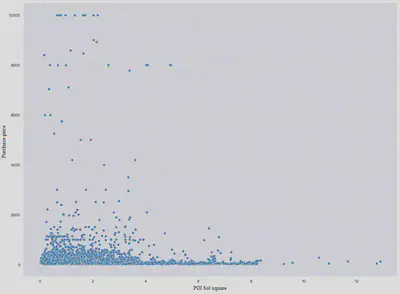
It is recommended to search for properties in one of the identified neighborhoods that are not necessarily close to points of interest.
- This properties are expected to have a lower purchase price.
- It appears that proximity to points of interest does not have a particular impact on rental prices.
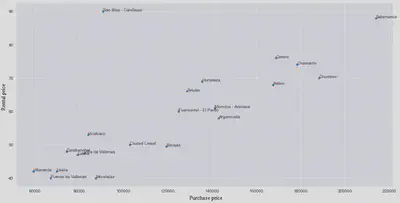
A new business model based on rentals for specific moments of high sporting interest, especially in the San Blas neighborhood should be explored.
- It is advisable to look for opportunities in the San Blas neighborhood.
- The relationship between the purchase price and the rental price per night is quite good.
- There are still many rentals that are not exploiting this potential.
Pedro Cortés Macías
Data scientist · Industrial Engineer
I love solving problems. More specifically, I love solving problems using code, maths and business knowledge. Using it for analysis and automation, helping people and companies to be more productive, make better decisions and create data-driven assets.