Dreem Resort Hotels Dashboard
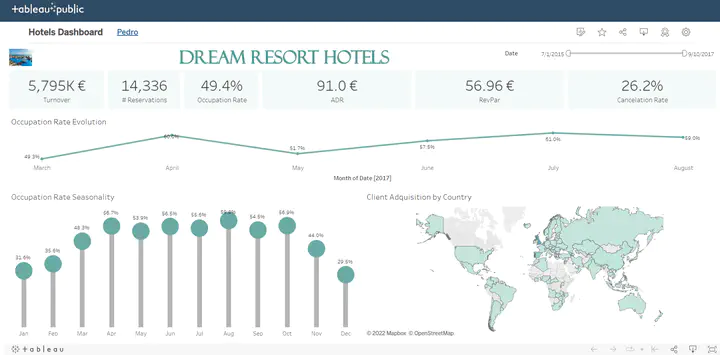
Table of contents
Introduction
The client is a hotel group specialized in the vacation market.
Objectives
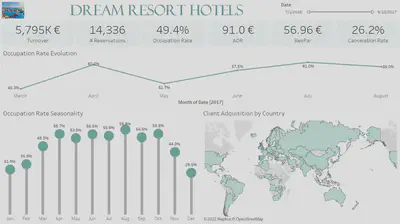
Create a dashboard that company managers can use to start managing hotels in a more data driven way.
Project design
1. Methodology
In order to make the best use of the time and resources available, initial time has been invested in the development of the methodology to be followed during the project.
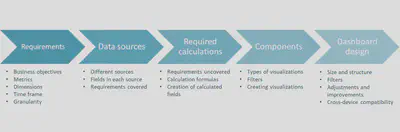
2. Taking requirements
In this first fundamental step the objective is to determine the requirements and scope of the project. To do this, meetings have been organised with the end users of the dashboard to understand what they expect from the use of the dashboard, what business problems they want to solve, what KPIs they want to measure, in what time frame they want to measure them, etc.
The following is a summary of the questions posed to the management team and their corresponding answers.
What business objectives do you want to achieve by developing this dashboard?
- To have in a single report the main data necessary for hotel management.
- With current date and also with a view of developments in the last few months.
- Get the entire management to use the same data and share the same metrics.
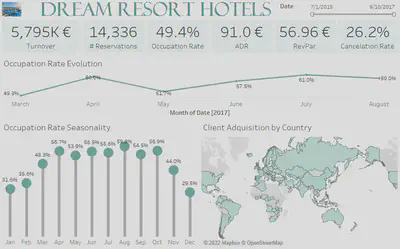
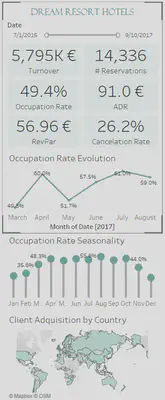
What data specifically would you like to visualize?
- Number of reservations
- Turnover
- Occupancy rate
- RevPar
- ADR
- Cancelation rate
Through which dimensions would you like to see such metrics?
- All of the above metrics and that specific dates can be selected to consult the data.
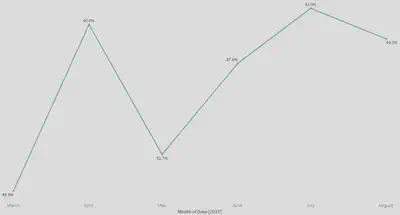
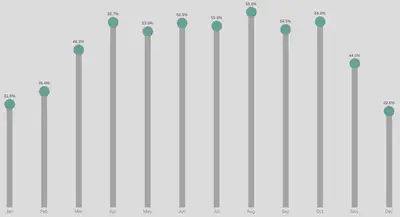
- To know the evolution of the occupancy rate for the last 6 months and its seasonality.
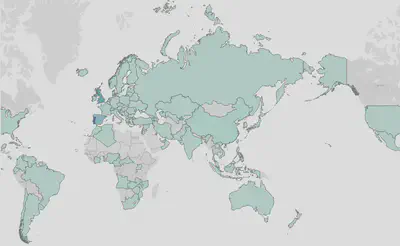
- To know the bookings according to the customer’s country.
What time frame do you need to visualize for the information?
- The longest possible history according to the information available in the data provided.
At what time unit would you like to see that information?
- To know the value of all the mentioned metrics according to the dates to be consulted.
- Evolution of the occupancy rate over the last 6 months
- For the seasonality of the occupancy rate, display all available historical data.
- For bookings by country, use all available data.
3. Data sources
The next stage of the project is to identify which data sources are available, where they are located, what information is available for each one, etc. In this case, the data provided by the company is contained in a single comma-separated values text file called ‘hotels.csv’.
This file directly contains the information of two of the metrics required by the client: the number of bookings and the ADR.
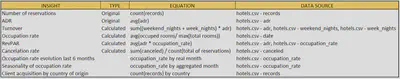
3. Required calculations
In this step the requirements demanded by the customer not directly covered by the information in the data sources are identified and it is determined how to calculate them through the existing information.
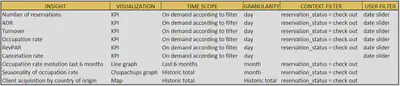
4. Dashboard components
Next, the most appropriate visualizations for each metric are selected and created.

5. Final Dashboard design
Finally, the dashboard design is addressed: its size and structure, its adaptation to different devices (pc, mobile, tablet...), dashboard level filters are set, etc.- The developed dashboard is publicly available here.
Pedro Cortés Macías
Data scientist · Industrial Engineer
I love solving problems. More specifically, I love solving problems using code, maths and business knowledge. Using it for analysis and automation, helping people and companies to be more productive, make better decisions and create data-driven assets.